Top States
Day Changers Top StatesAug 2026
Top states where Day Changers is active based on indexed sales coverage.
Is this your Brand? Log in to Hoodie!
Aug 2026
DAY CHANGERS has experienced an impressive 75.3% YoY growth, now firmly positioned in the mid-tier with a rank improvement from #10 to #6 in Oklahoma. The last three months show a positive trend of 9.8%, reflecting strong consumer interest in their offerings.
Categories
Top States
Top states where Day Changers is active based on indexed sales coverage.
Trend View
24-Month Trend
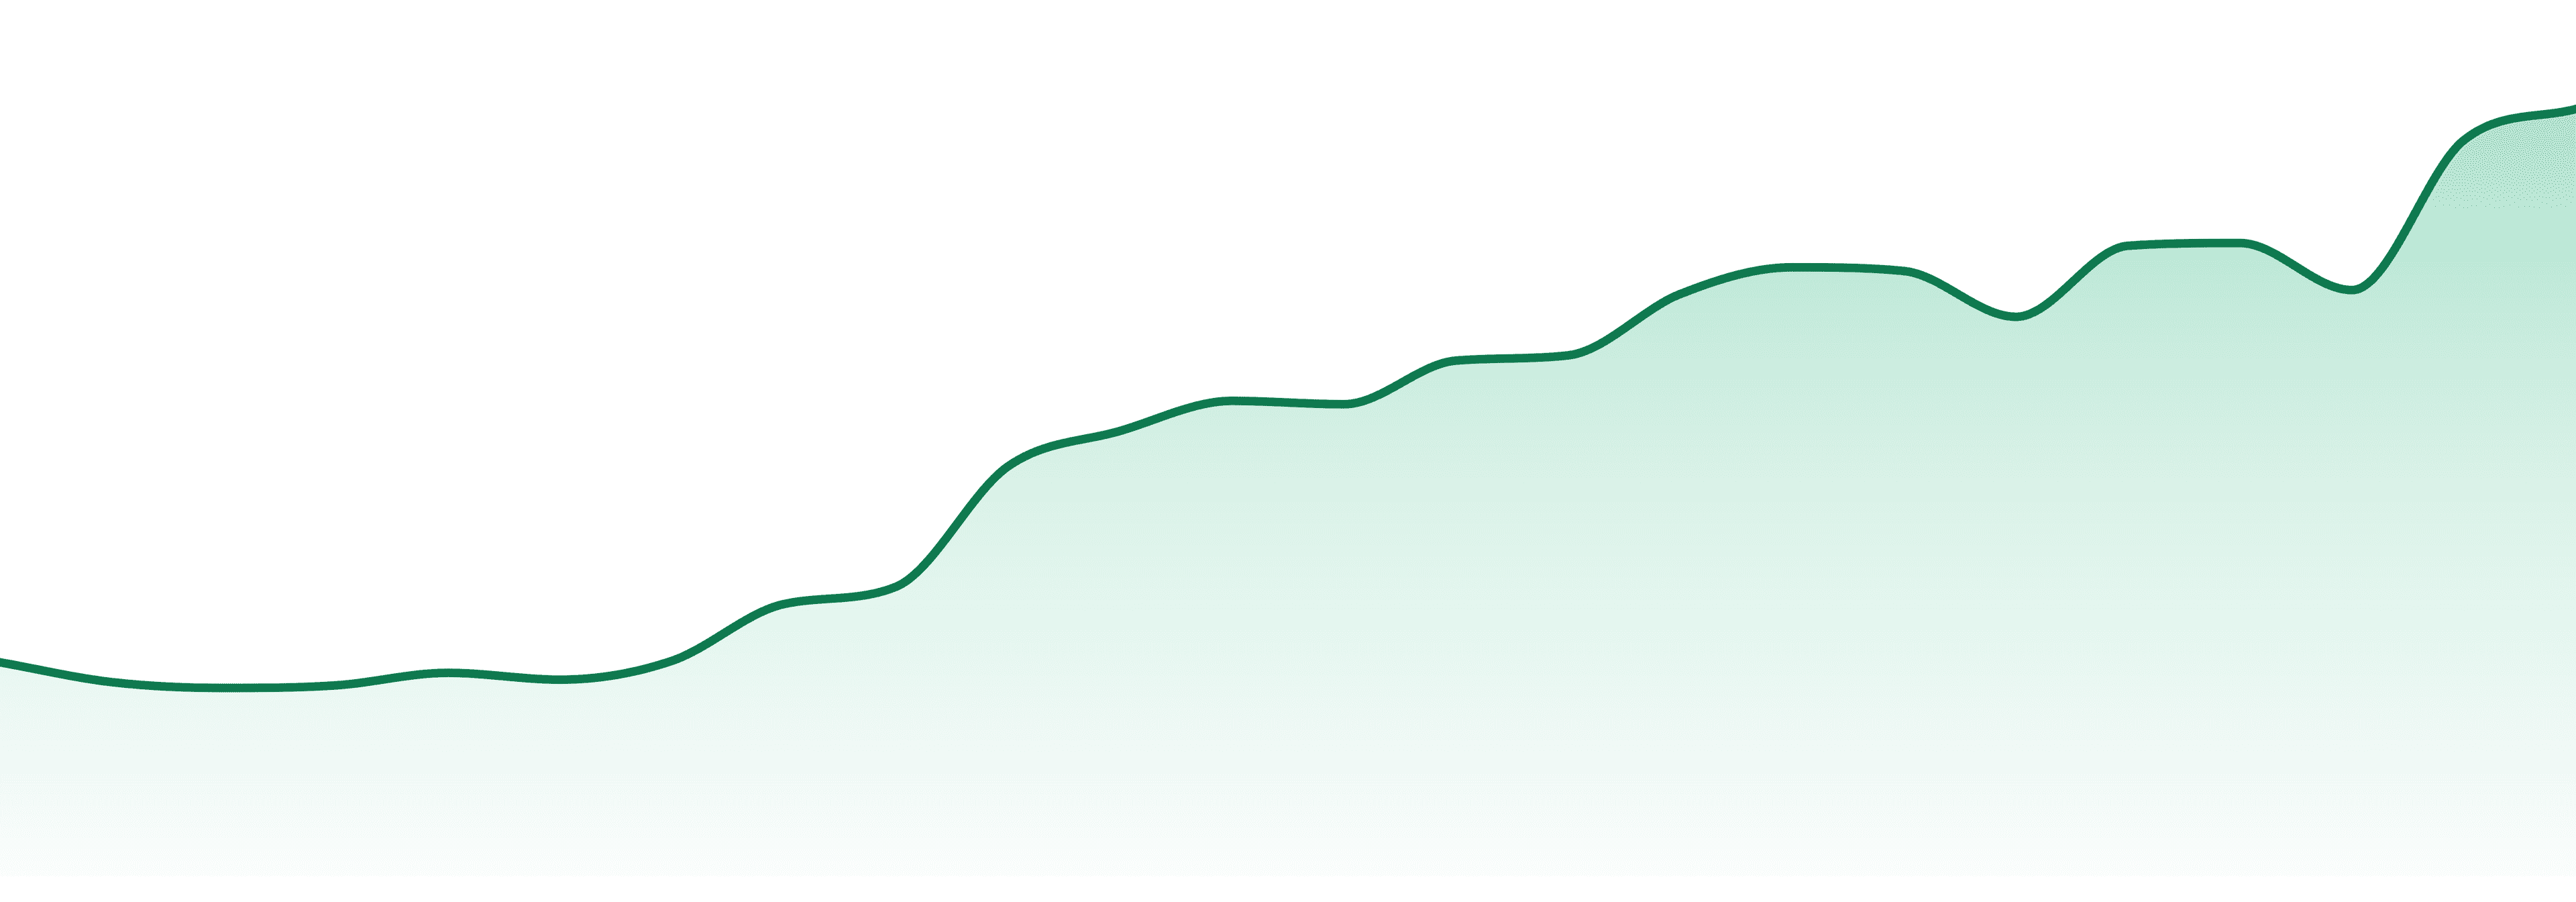
Average Price
$20.68
YoY Sales Trend
61.4%
2Y Sales Trend
291.7%
Edibles dominate with a staggering 99.8% share, growing 75.1% YoY, making it the fastest-growing category. This concentration highlights the brand's strategic focus on a single, high-demand product segment.
| Category | Sales Share | Avg Price | YoY |
|---|---|---|---|
Unlock The Full Table
Log in to unlock the full category breakout table and image export actions for this brand.
Trend View
24-Month Trend
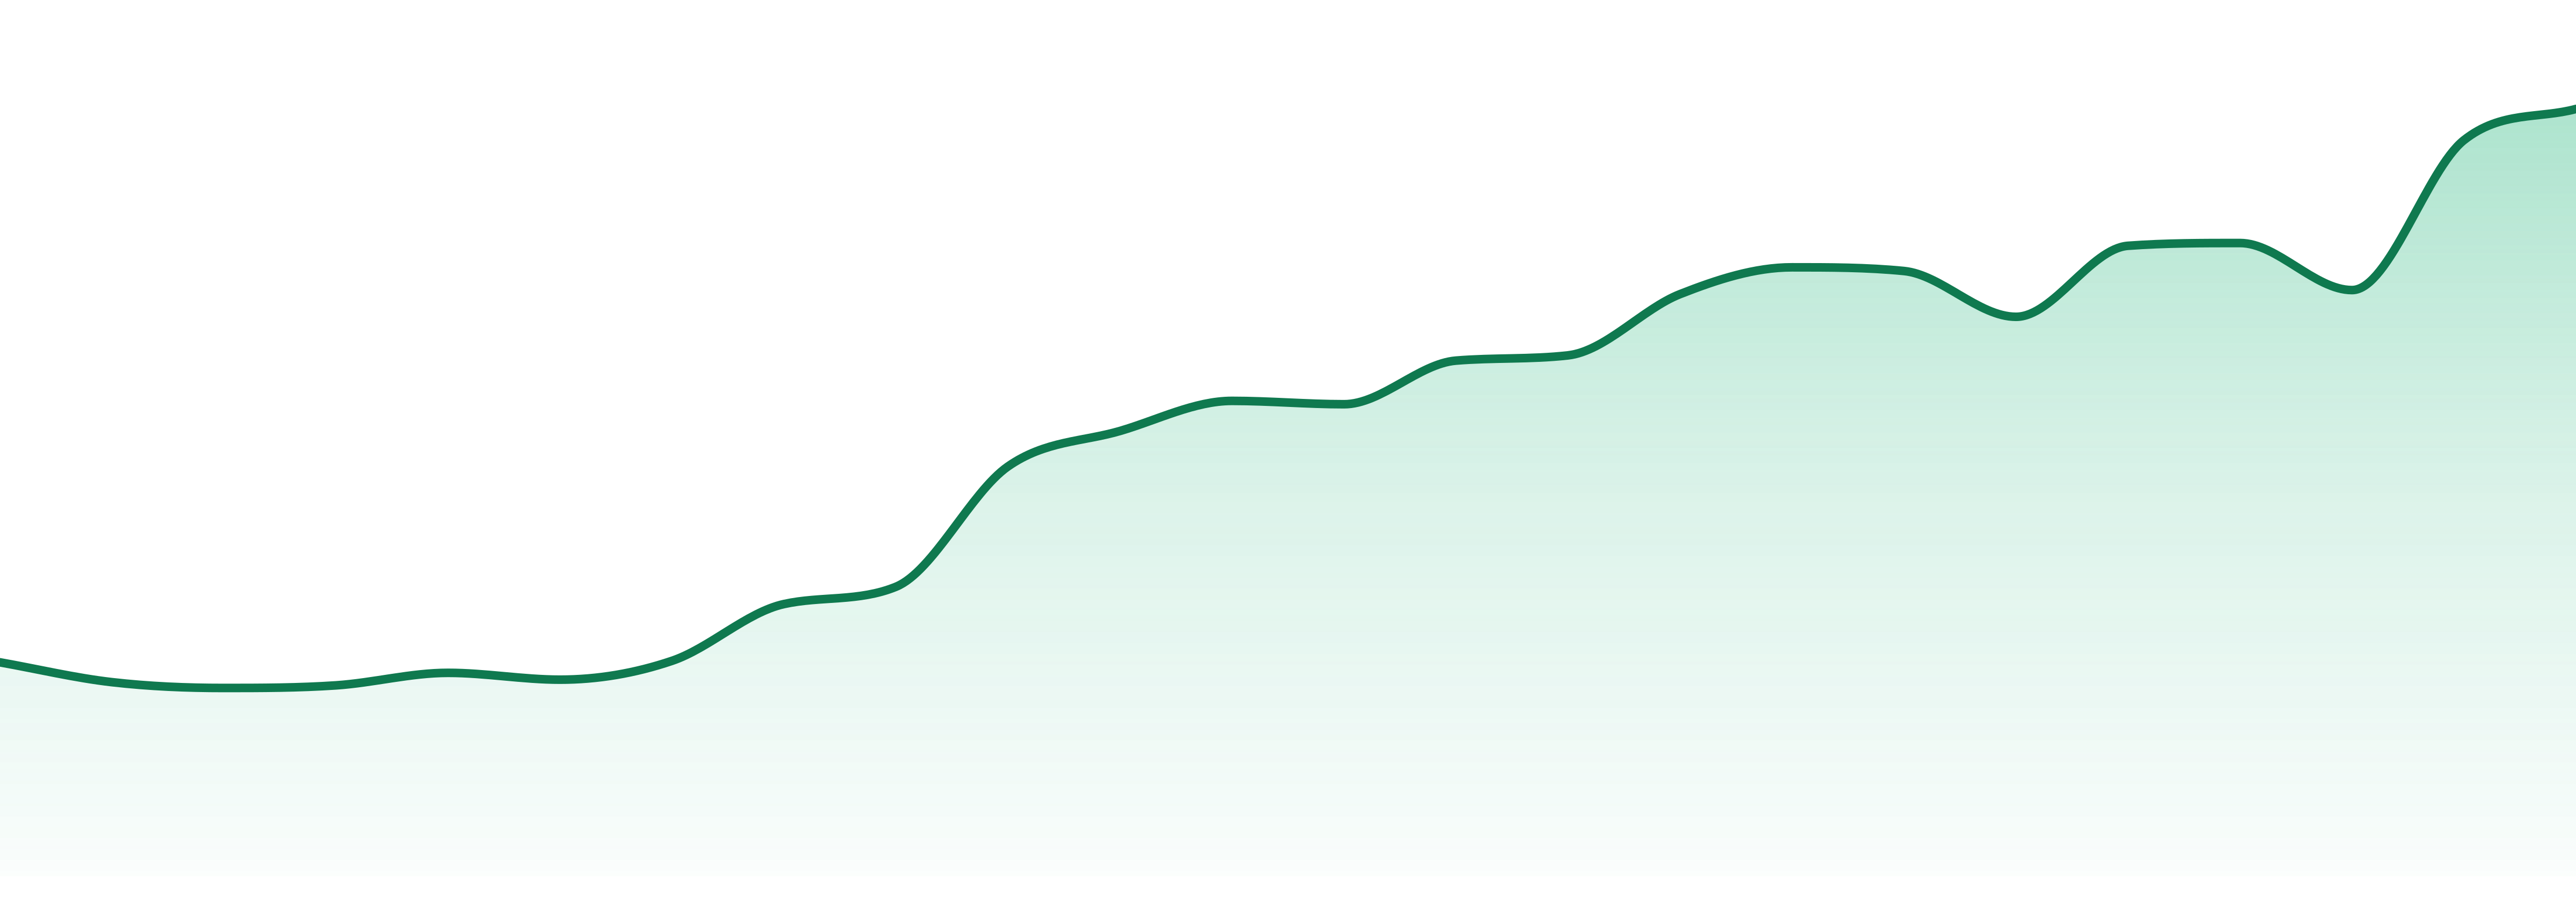
Average Price
$20.68
YoY Sales Trend
61.4%
2Y Sales Trend
291.7%
Category Breakout
| Category | Sales Share | Avg Price | YoY |
|---|---|---|---|
| Edibles | 100.0% | $20.67 | 61.4% |
State Rank Table
| State | Edibles | Flower | Pre-Roll |
|---|---|---|---|
| Oklahoma | 3 | ⊖ | ⊖ |
DAY CHANGERS operates exclusively in Oklahoma, where it commands 100% of its sales. This geographic concentration emphasizes the brand's strong foothold in the state as a leading player.
| State | Edibles | Flower | Pre-Roll |
|---|---|---|---|
Unlock The Full Table
Log in to unlock the full state rank table and compare every category row for this brand.
Market Position
DAY CHANGERS ranks #6 in the Edibles category, trailing behind leaders like SMOKIEZ (#1) and WYLD (#2). The brand's ascent from #10 to #6 within a year showcases its competitive momentum in a fiercely contested market.
SKU View
Top products for Aug 2026 with sales and momentum indicators.
| Product | Category | MoM |
|---|---|---|
#2  | Edibles | 11.4% |
#4  | Edibles | 27.7% |
#6  | Edibles | 278.9% |
#8  | Edibles | 337.6% |
#10  | Edibles | 199.5% |
Unlock The Full Table
Log in to unlock the full top selling products table and export the share image for this section.
Benchmarking
Peer brands benchmarked against Day Changers using competitive landscape rank coverage, proximity, and momentum.