Top States
The Tea House Top StatesJun 2026
Top states where The Tea House is active based on indexed sales coverage.
Is this your Brand? Log in to Hoodie!
Jun 2026
Top States
Top states where The Tea House is active based on indexed sales coverage.
Trend View
24-Month Trend

Average Price
$15.27
YoY Sales Trend
483.2%
2Y Sales Trend
Market Position
Ranked #22 in Flower, THE TEA HOUSE is 21 spots behind market leader SATORI. Competing brands include HEY BUD, PINNACLE VALLEY FARMS, and others, with notable shifts in rank over the past year.
SKU View
Top products for Jun 2026 with sales and momentum indicators.
| Product | Category | MoM |
|---|---|---|
#1  | Flower | 466.2% |
#2  |
Benchmarking
Peer brands benchmarked against The Tea House using competitive landscape rank coverage, proximity, and momentum.
Unlock The Full Brand Profile
See verified owner contacts, buyer org charts, and direct outreach paths for this brand.
YoY growth at +17.6% for THE TEA HOUSE in the mid-tier category—rank improved from #26 to #22 in Vermont. Despite a 10.7% decline over the last three months, recent trends show a 15.9% monthly increase, highlighting potential for recovery.
Categories
Flower dominates at 70.3% of total sales, with a steady YoY increase of 4.0%. Pre-Rolls are the standout performer at +159.0% YoY, while Vapes lag significantly, down 32.2% YoY.
| Category | Sales Share | Avg Price | YoY |
|---|---|---|---|
| Flower | 68.6% | $16.06 | 1159.2% |
| Pre-Rolls | 11.4% | $6.93 | 198.9% |
| Vapes | 8.7% | $39.54 | 33.5% |
| Edibles | 5.2% | $28.78 | 909.1% |
| Accessories | 4.1% | $24.47 | 749.3% |
| Concentrates | 2.1% | $34.18 | 443.8% |
Trend View
24-Month Trend
Average Price
$15.27
YoY Sales Trend
483.2%
2Y Sales Trend
1540.5%
Category Breakout
| Category | Sales Share | Avg Price | YoY |
|---|---|---|---|
| Flower | 68.6% | $16.06 | 1159.2% |
| Pre-Rolls | 11.4% | $6.93 | 198.9% |
| Vapes | 8.7% | $39.54 | 33.5% |
| Edibles | 5.2% | $28.78 | 909.1% |
| Accessories | 4.1% | $24.47 | 749.3% |
State Rank Table
| State | Flower | Pre-Roll | Vapes | Edibles | Accessories | Concentrates |
|---|---|---|---|---|---|---|
| Vermont | 11 | 42 | 38 | 28 | 5 | 37 |
THE TEA HOUSE holds a strong position in Vermont, which represents 100% of its sales. Geographic concentration is high, with no other states contributing to revenue.
| State | Flower | Pre-Roll | Vapes | Edibles | Accessories | Concentrates |
|---|---|---|---|---|---|---|
| 11 | 42 | 38 | 28 | 5 | 37 |
| Flower |
| N/A |
#3  | Flower | N/A |
#4 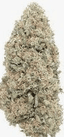 | Flower | N/A |
#5  | Flower | N/A |
#6  | Vapes | 24.1% |
#7 | Flower | 5.3% |
#8  | Flower | 17.5% |
#9  | Pre-Rolls | 13.1% |
| Concentrates |
| 2.1% |
| $34.18 |
| 443.8% |


