Top States
 House Party Top StatesAug 2026
Top states where House Party is active based on indexed sales coverage.
Is this your Brand? Log in to Hoodie!
Aug 2026
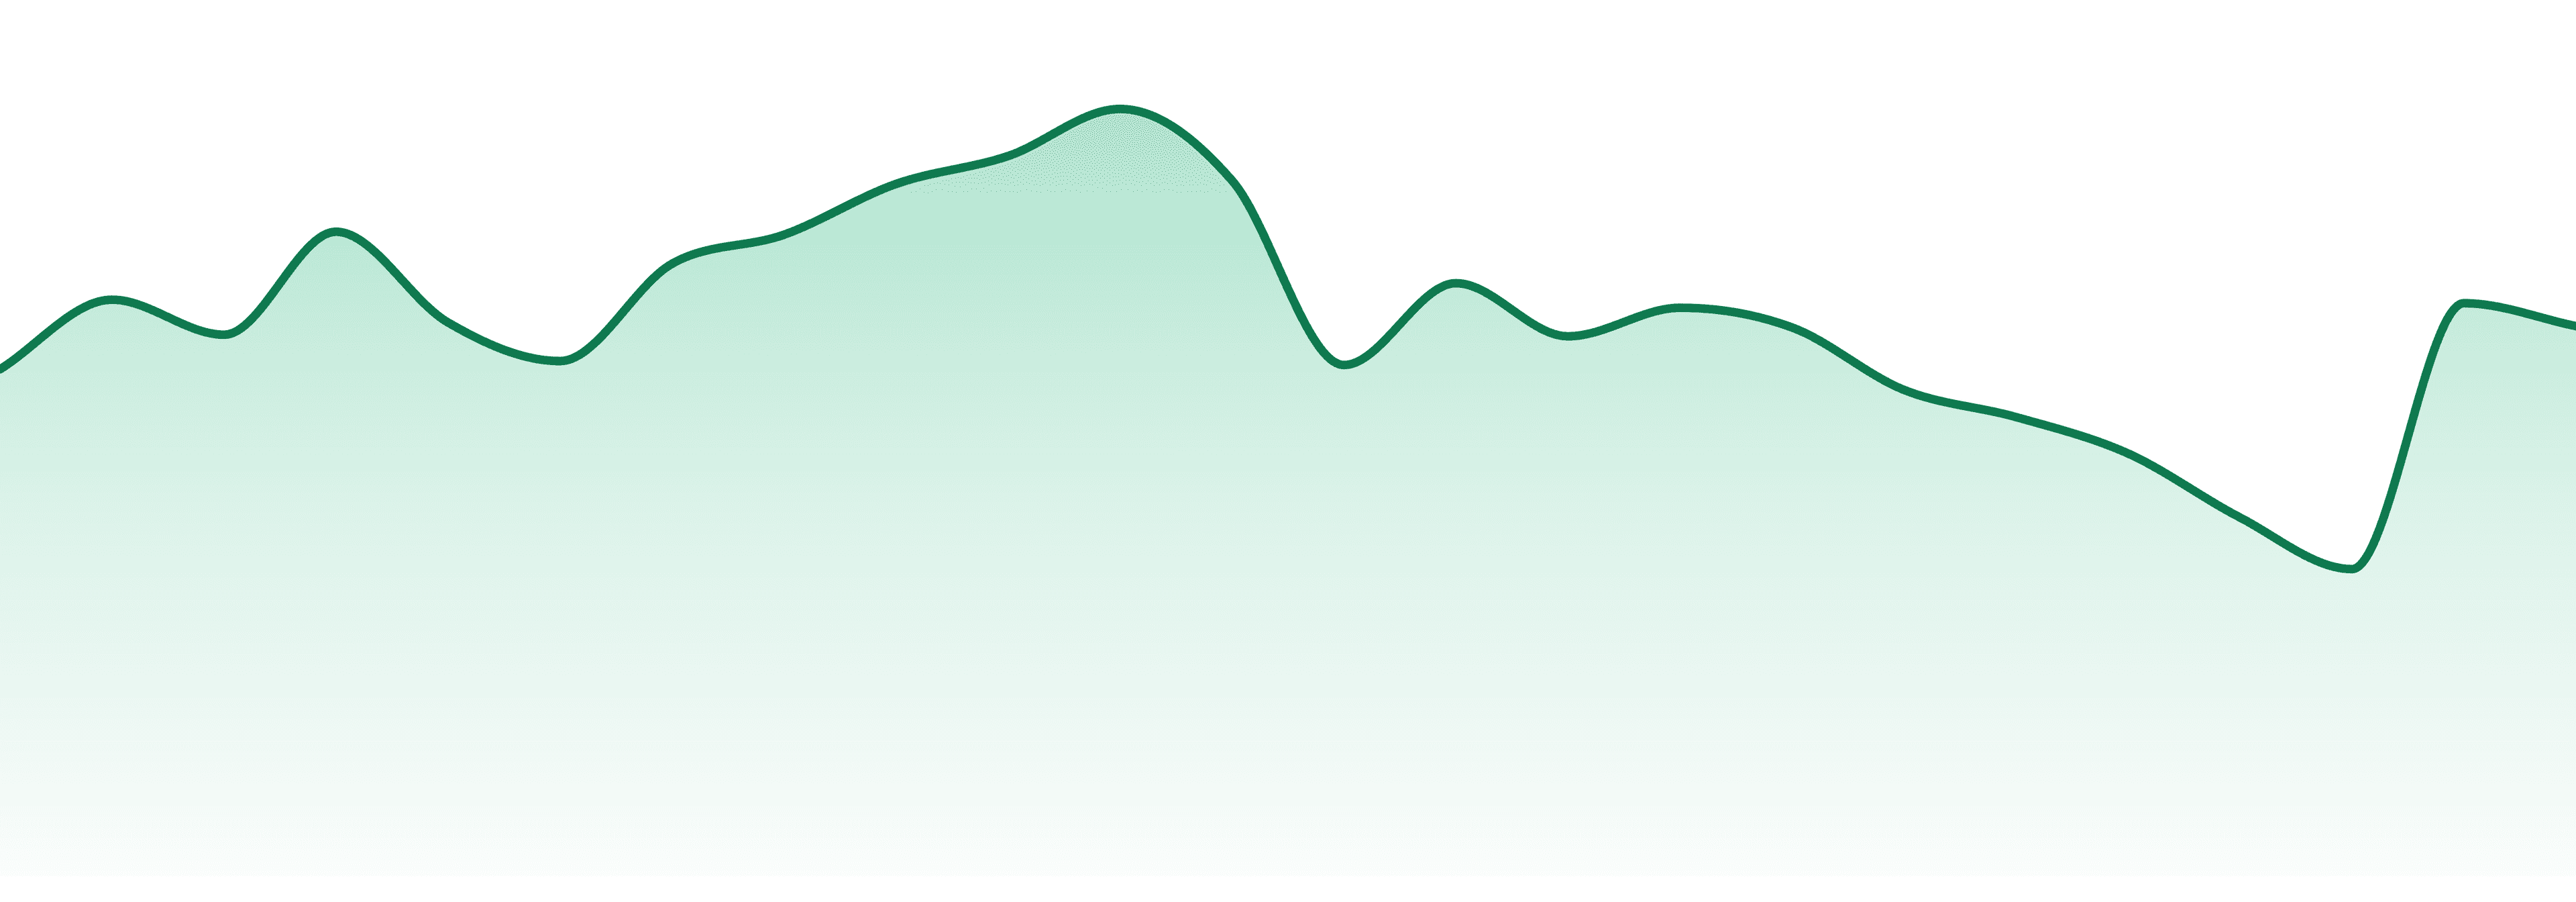
HOUSE PARTY's sales plummeted 60.5% YoY, underscoring a major struggle in a premium market. With a steep three-month trend of -56%, the brand is losing ground while adjusting prices fails to attract consumers.
Categories
Top States
House Party Top StatesAug 2026Top states where House Party is active based on indexed sales coverage.
Trend View
Market Insights SnapshotAug 202624-Month Trend
Average Price
$52.07
YoY Sales Trend
20.9%
2Y Sales Trend
15.5%
Flower dominates at 88.5% of total sales but is down 54.1% YoY. Vapes have seen the sharpest decline at 68.6% YoY, while Pre-Rolls hold a smaller share at 2.7% with a 24.7% drop YoY.
| Category | Sales Share | Avg Price | YoY |
|---|---|---|---|
| Pre-Rolls | 3.2% | $48.43 | 284.7% |
Unlock The Full Table
Log in to unlock the full category breakout table and image export actions for this brand.
Trend View
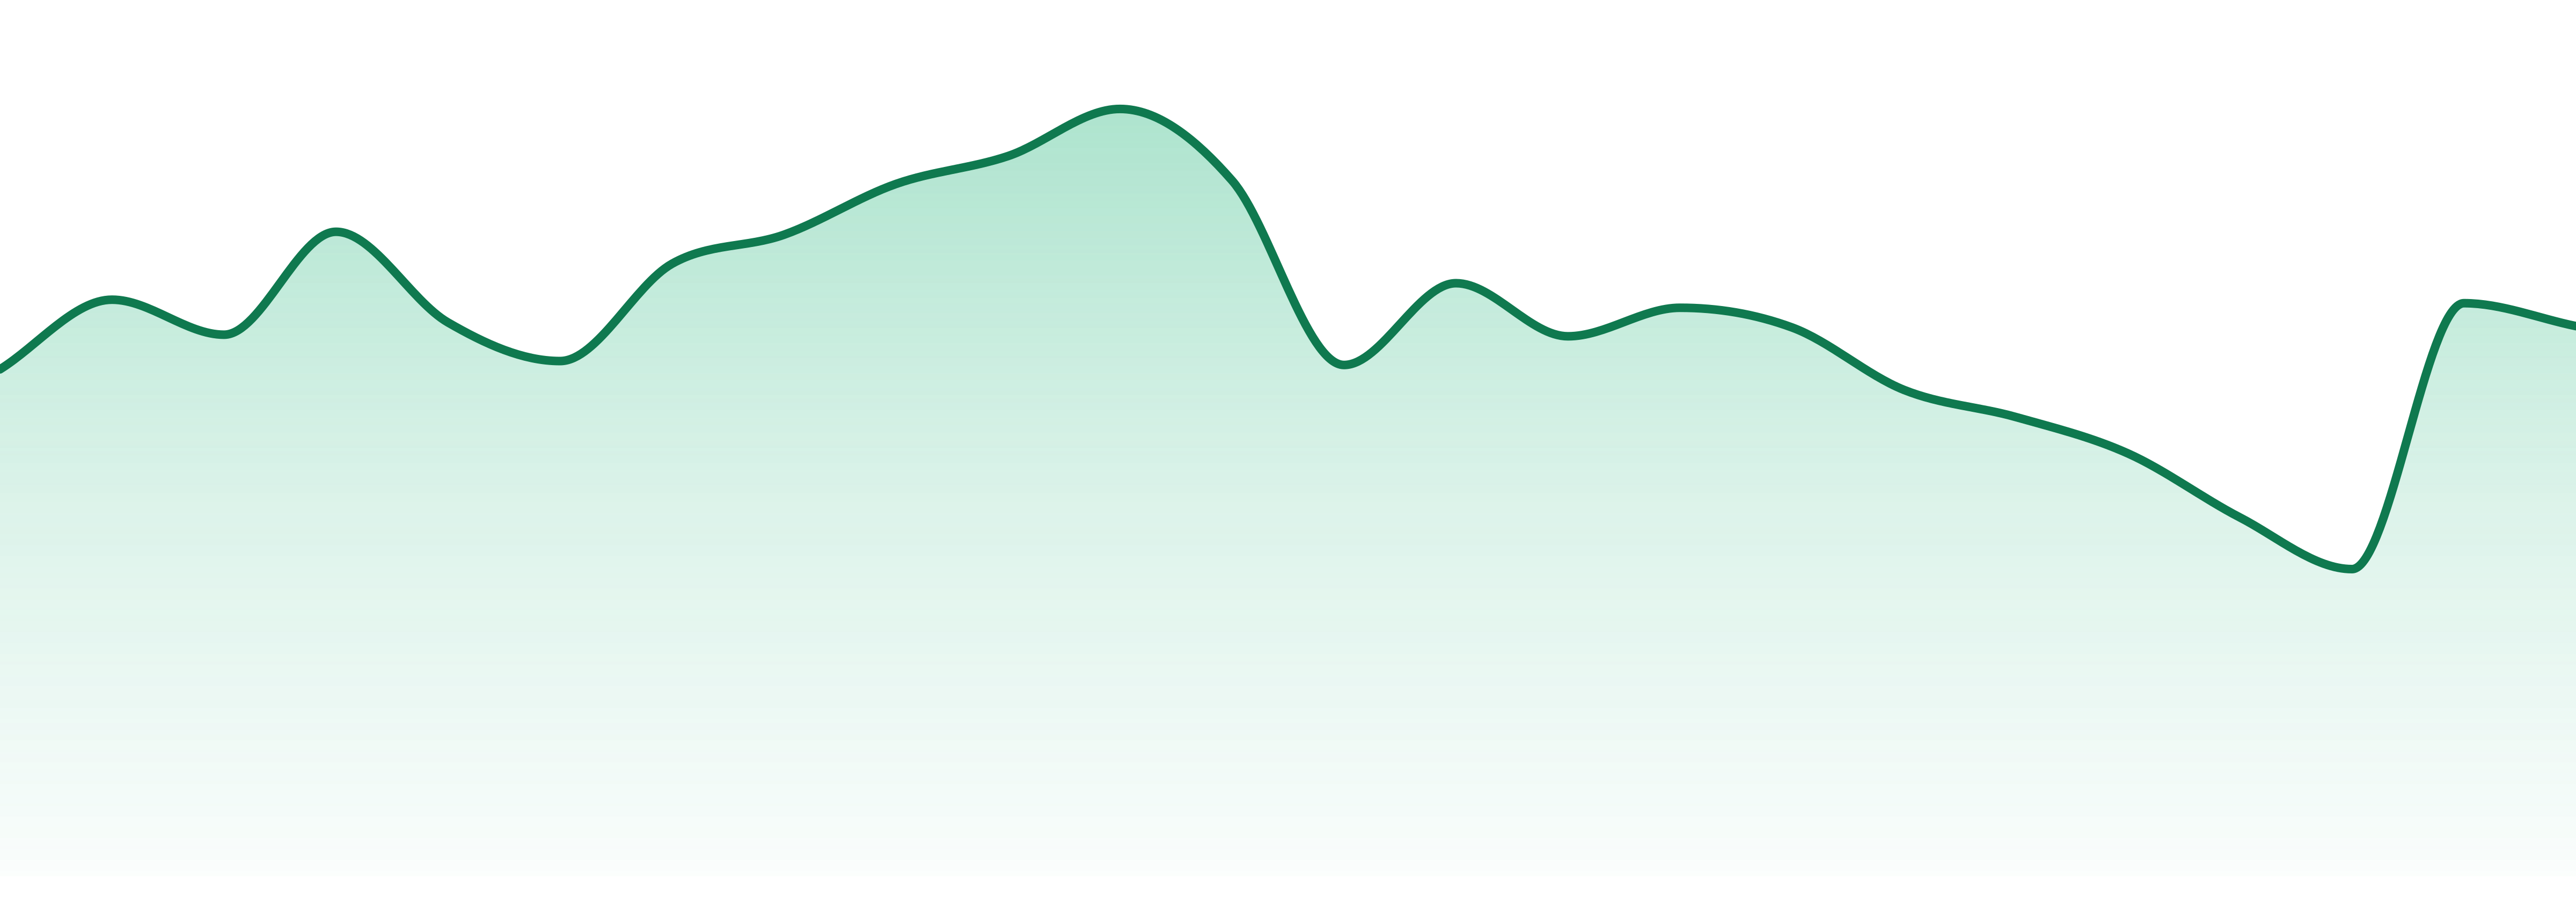
Market Insights SnapshotAug 202624-Month Trend
Average Price
$52.07
YoY Sales Trend
20.9%
2Y Sales Trend
15.5%
Category Breakout
| Category | Sales Share | Avg Price | YoY |
|---|---|---|---|
| Flower | 96.8% | $52.39 | 7.5% |
| Pre-Rolls | 3.2% | $48.43 | 284.7% |
State Rank Table
| State | Flower | Pre-Roll | Accessories | Concentrates | Vapor Pens |
|---|---|---|---|---|---|
| Oregon | 40 | ⊖ | ⊖ | ⊖ | ⊖ |
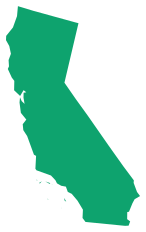
HOUSE PARTY's strongest presence is in Oregon, accounting for 80.2% of sales, followed by California at 19.8%. The brand operates in 2 states, highlighting concentrated regional activity.
| State | Flower | Pre-Roll | Accessories | Concentrates | Vapor Pens |
|---|---|---|---|---|---|
Unlock The Full Table
Log in to unlock the full state rank table and compare every category row for this brand.
Market Position
Competitive LandscapeAug 2026HOUSE PARTY ranks #46 in the Flower category, slipping from #29 last year. Competing brands include CANNABIS NATION DISPENSARIES and MERAKI GARDENS, with a significant gap of 45 spots to the leader.
SKU View
Top Selling ProductsAug 2026Top products for Aug 2026 with sales and momentum indicators.
| Product | Category | MoM |
|---|---|---|
#2  | Flower | N/A |
#4  | Flower | 12.2% |
#6  | Flower | 168.4% |
#8  | Flower | 34.3% |
Unlock The Full Table
Log in to unlock the full top selling products table and export the share image for this section.
Benchmarking
Peer brands benchmarked against House Party using competitive landscape rank coverage, proximity, and momentum.