

Top States
 Good Feels Top StatesAug 2026
Top states where Good Feels is active based on indexed sales coverage.
Is this your Brand? Log in to Hoodie!
Aug 2026
Where food and drink are a labor of love, Good Feels’ seltzers and mix ins more than just great recipes. Happy people make better beverages. Better beverages make people happy. We know you’ll feel the difference.
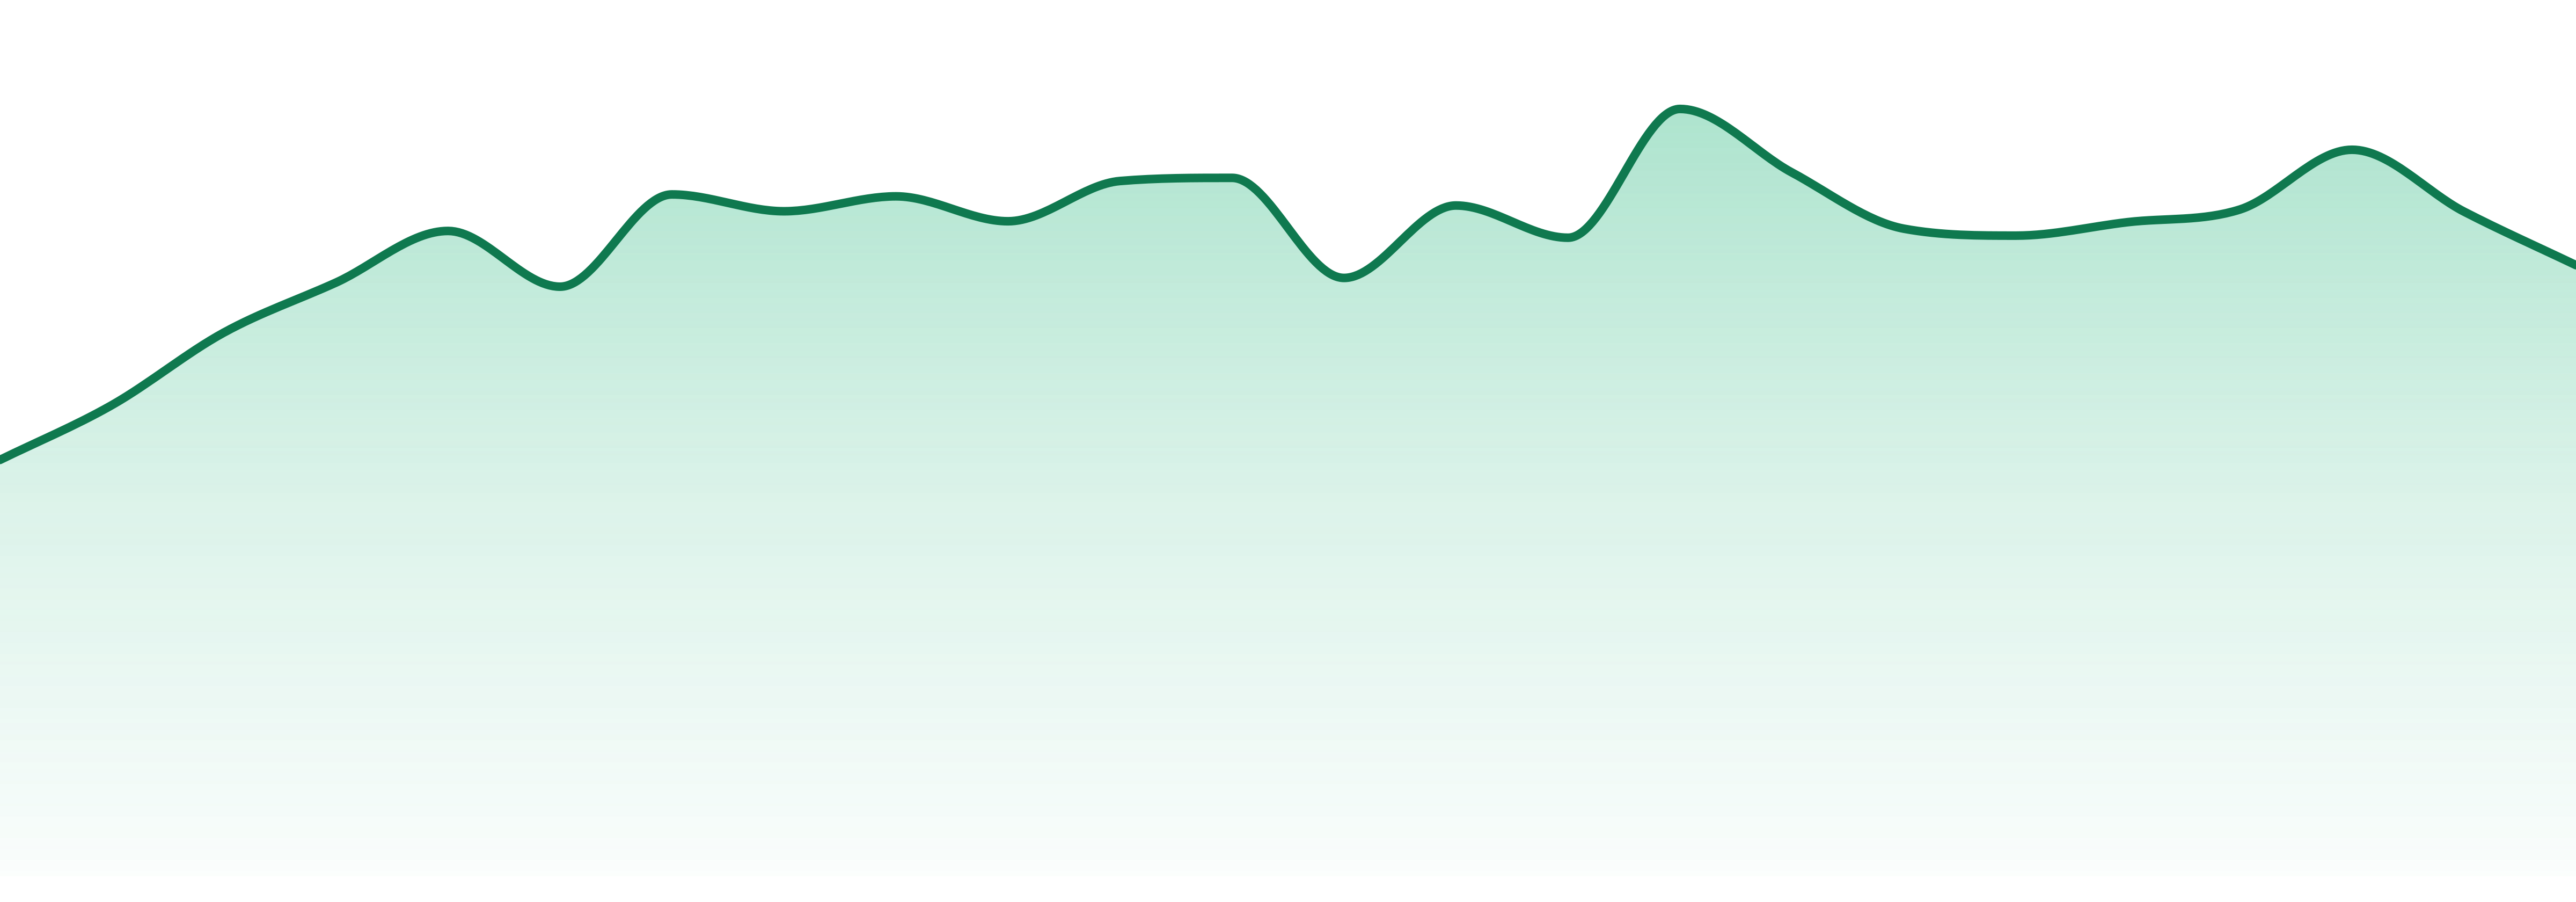
GOOD FEELS faces a significant challenge with a 21.7% decline in year-over-year growth—unit volume also fell sharply, hinting at potential pricing issues in a competitive landscape. Premium positioning could be at risk as sales drop continues.
Categories
Top States
Good Feels Top StatesAug 2026Top states where Good Feels is active based on indexed sales coverage.
Trend View
Market Insights SnapshotAug 202624-Month Trend

Average Price
$39.38
YoY Sales Trend
12.5%
2Y Sales Trend
38.5%
Edibles dominate at 81% but are down 23.6% YoY. Oral products hold 16.8% with an 18.9% decline, while concentrates surge at 2.3%, showcasing a remarkable 103.4% growth YoY—the fastest in the category.
| Category | Sales Share | Avg Price | YoY |
|---|---|---|---|
| Oral | 27.2% | $38.24 | 4.2% |
Unlock The Full Table
Log in to unlock the full category breakout table and image export actions for this brand.
Trend View
Market Insights SnapshotAug 202624-Month Trend
Average Price
$39.38
YoY Sales Trend
12.5%
2Y Sales Trend
38.5%
Category Breakout
| Category | Sales Share | Avg Price | YoY |
|---|---|---|---|
| Edibles | 72.8% | $39.83 | 16.9% |
| Oral | 27.2% | $38.24 | 4.2% |
State Rank Table
| State | Edibles | Oral | Concentrates |
|---|---|---|---|
| Massachusetts | 7 | 2 | ⊖ |
GOOD FEELS is concentrated solely in Massachusetts, accounting for 100% of its sales. This limited geographic footprint emphasizes the need for expansion to diversify revenue streams.
| State | Edibles | Oral | Concentrates |
|---|---|---|---|
Unlock The Full Table
Log in to unlock the full state rank table and compare every category row for this brand.
Market Position
Competitive LandscapeAug 2026Ranked #31 in the competitive edibles category, GOOD FEELS falls behind leaders like BETTY'S EDDIES and WYLD, with a notable slip from #27 to #31 in the past year. Competing brands dominate the market, leaving GOOD FEELS 30 spots behind the leader.
SKU View
Top Selling ProductsAug 2026Top products for Aug 2026 with sales and momentum indicators.
| Product | Category | MoM |
|---|---|---|
#2  | Edibles | 26.5% |
#4  | Edibles | 1.8% |
#6 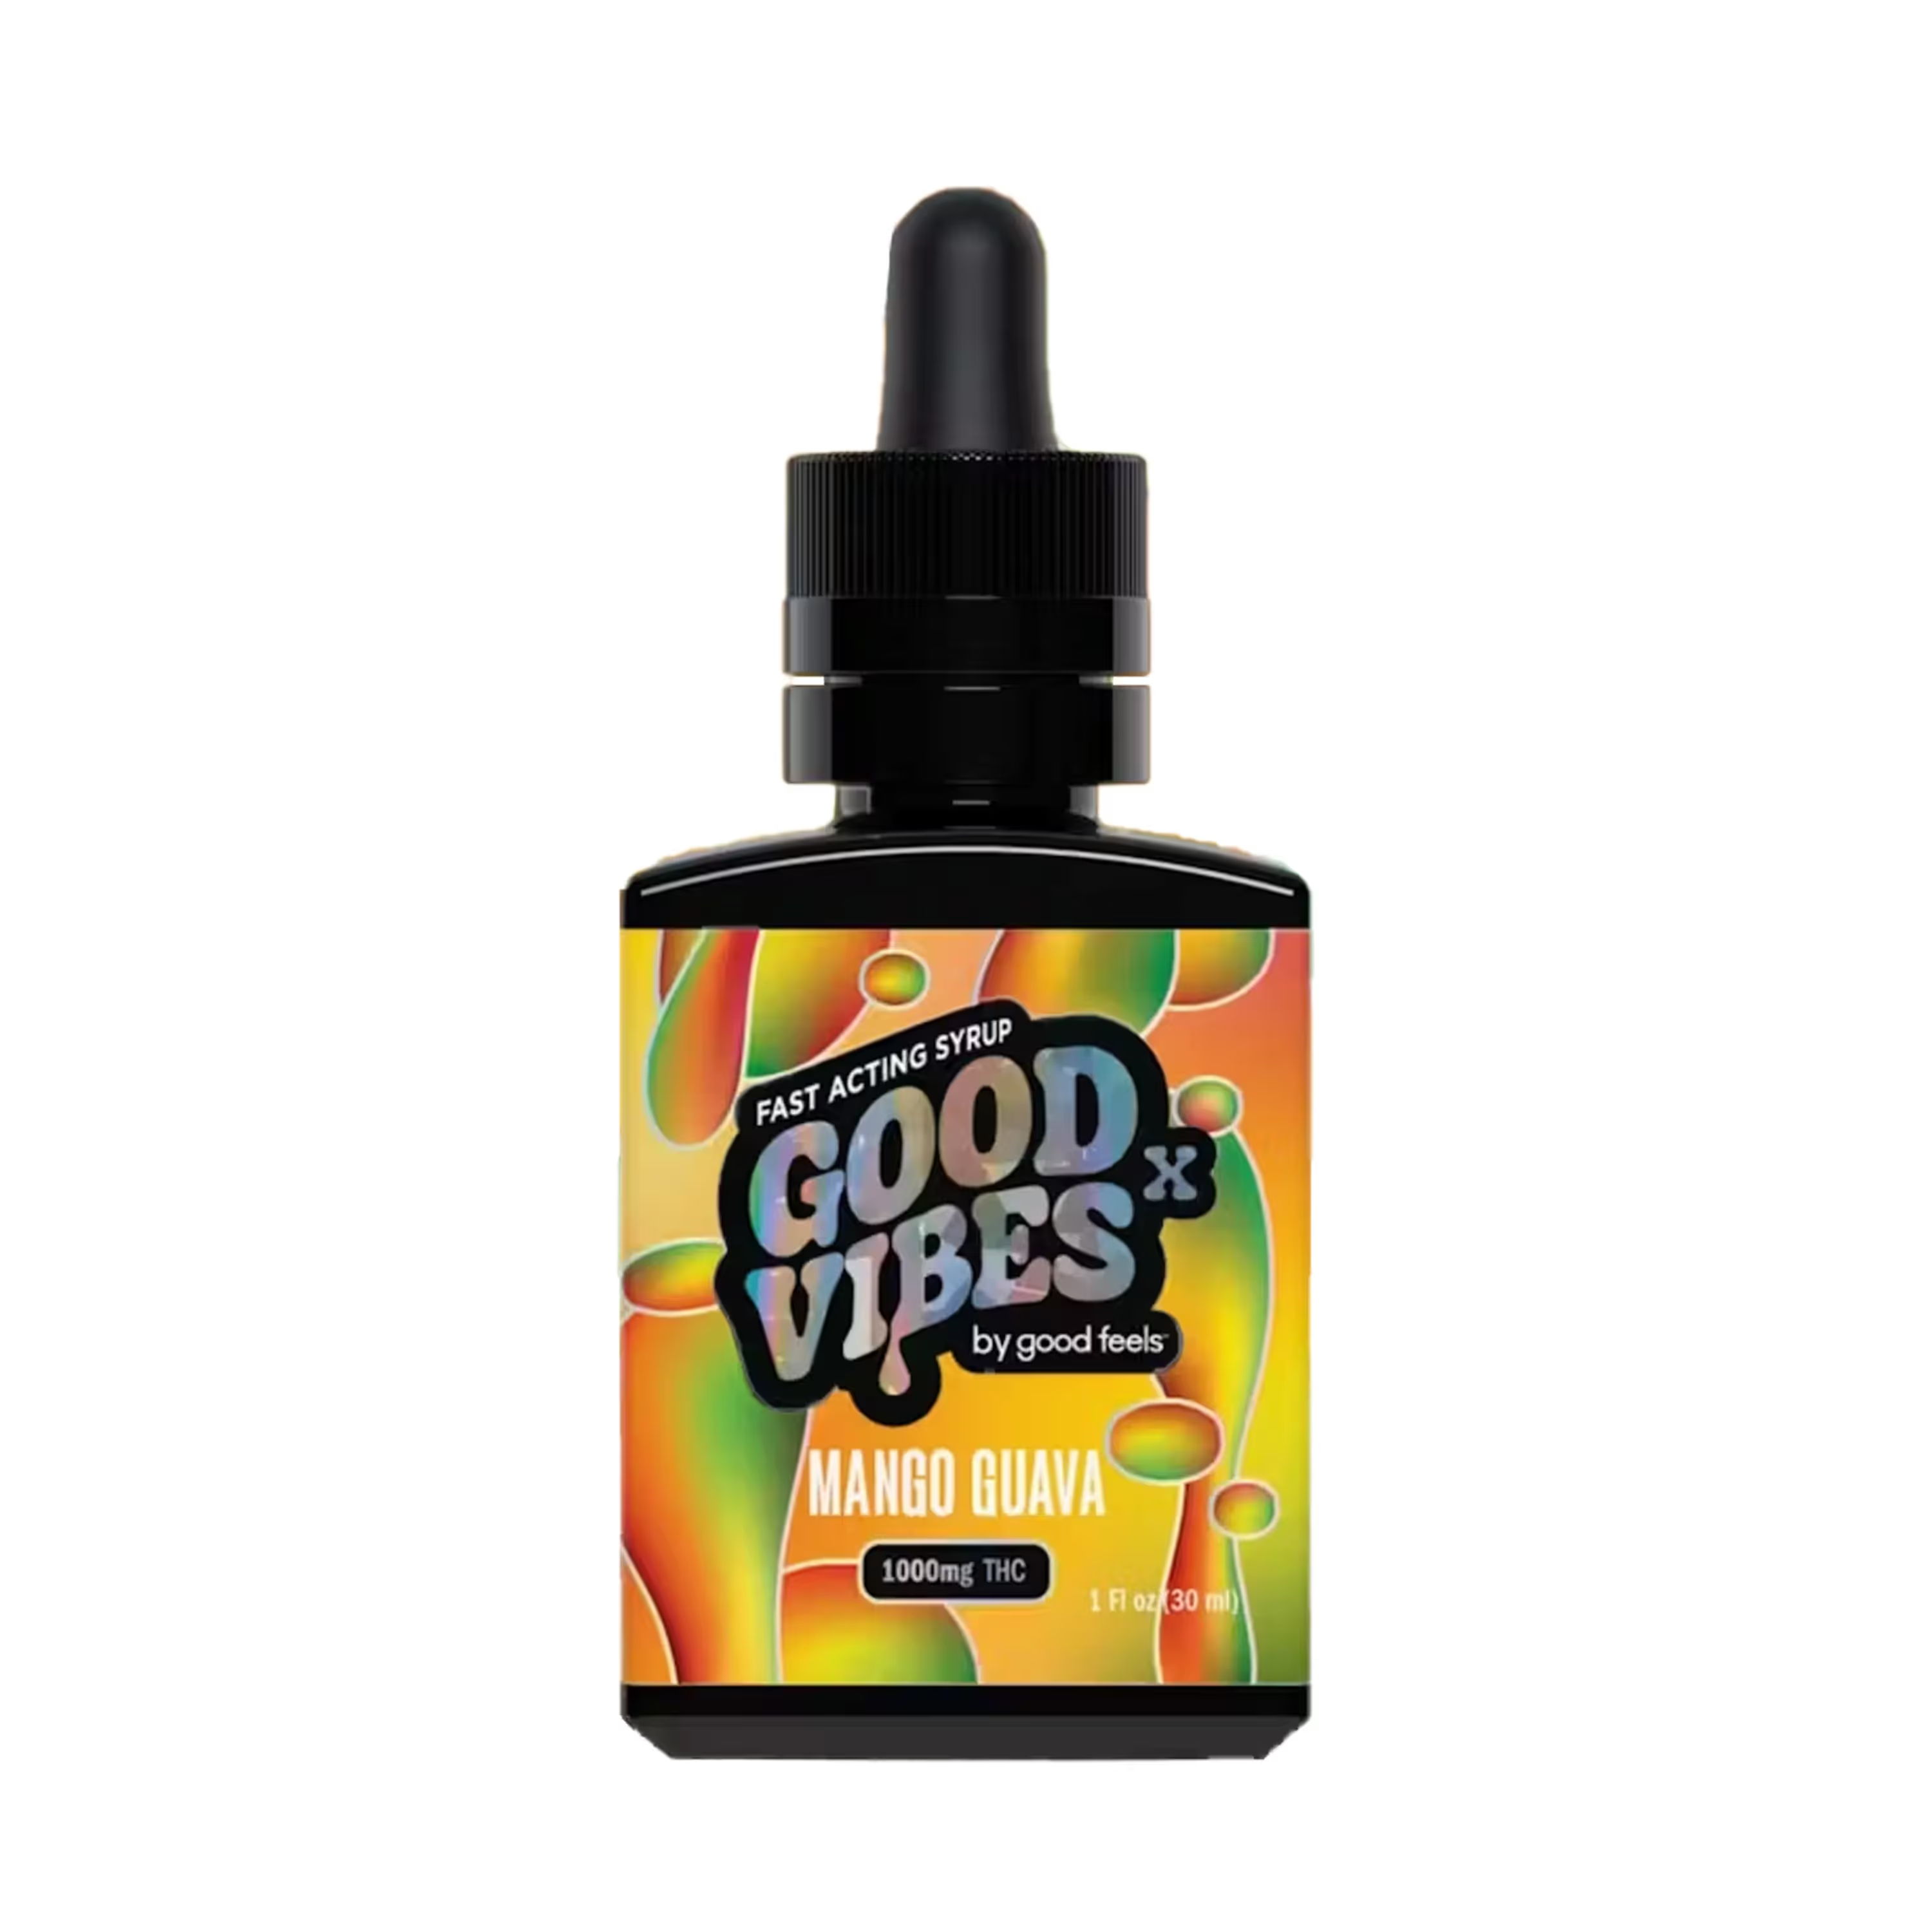 | Edibles | 64.8% |
#8  | Edibles | 102.8% |
#10  | Edibles | 56.9% |
Unlock The Full Table
Log in to unlock the full top selling products table and export the share image for this section.
Benchmarking
Peer brands benchmarked against Good Feels using competitive landscape rank coverage, proximity, and momentum.


