Top States
 Dialed In Gummies Top StatesAug 2026
Top states where Dialed In Gummies is active based on indexed sales coverage.
Is this your Brand? Log in to Hoodie!
Aug 2026
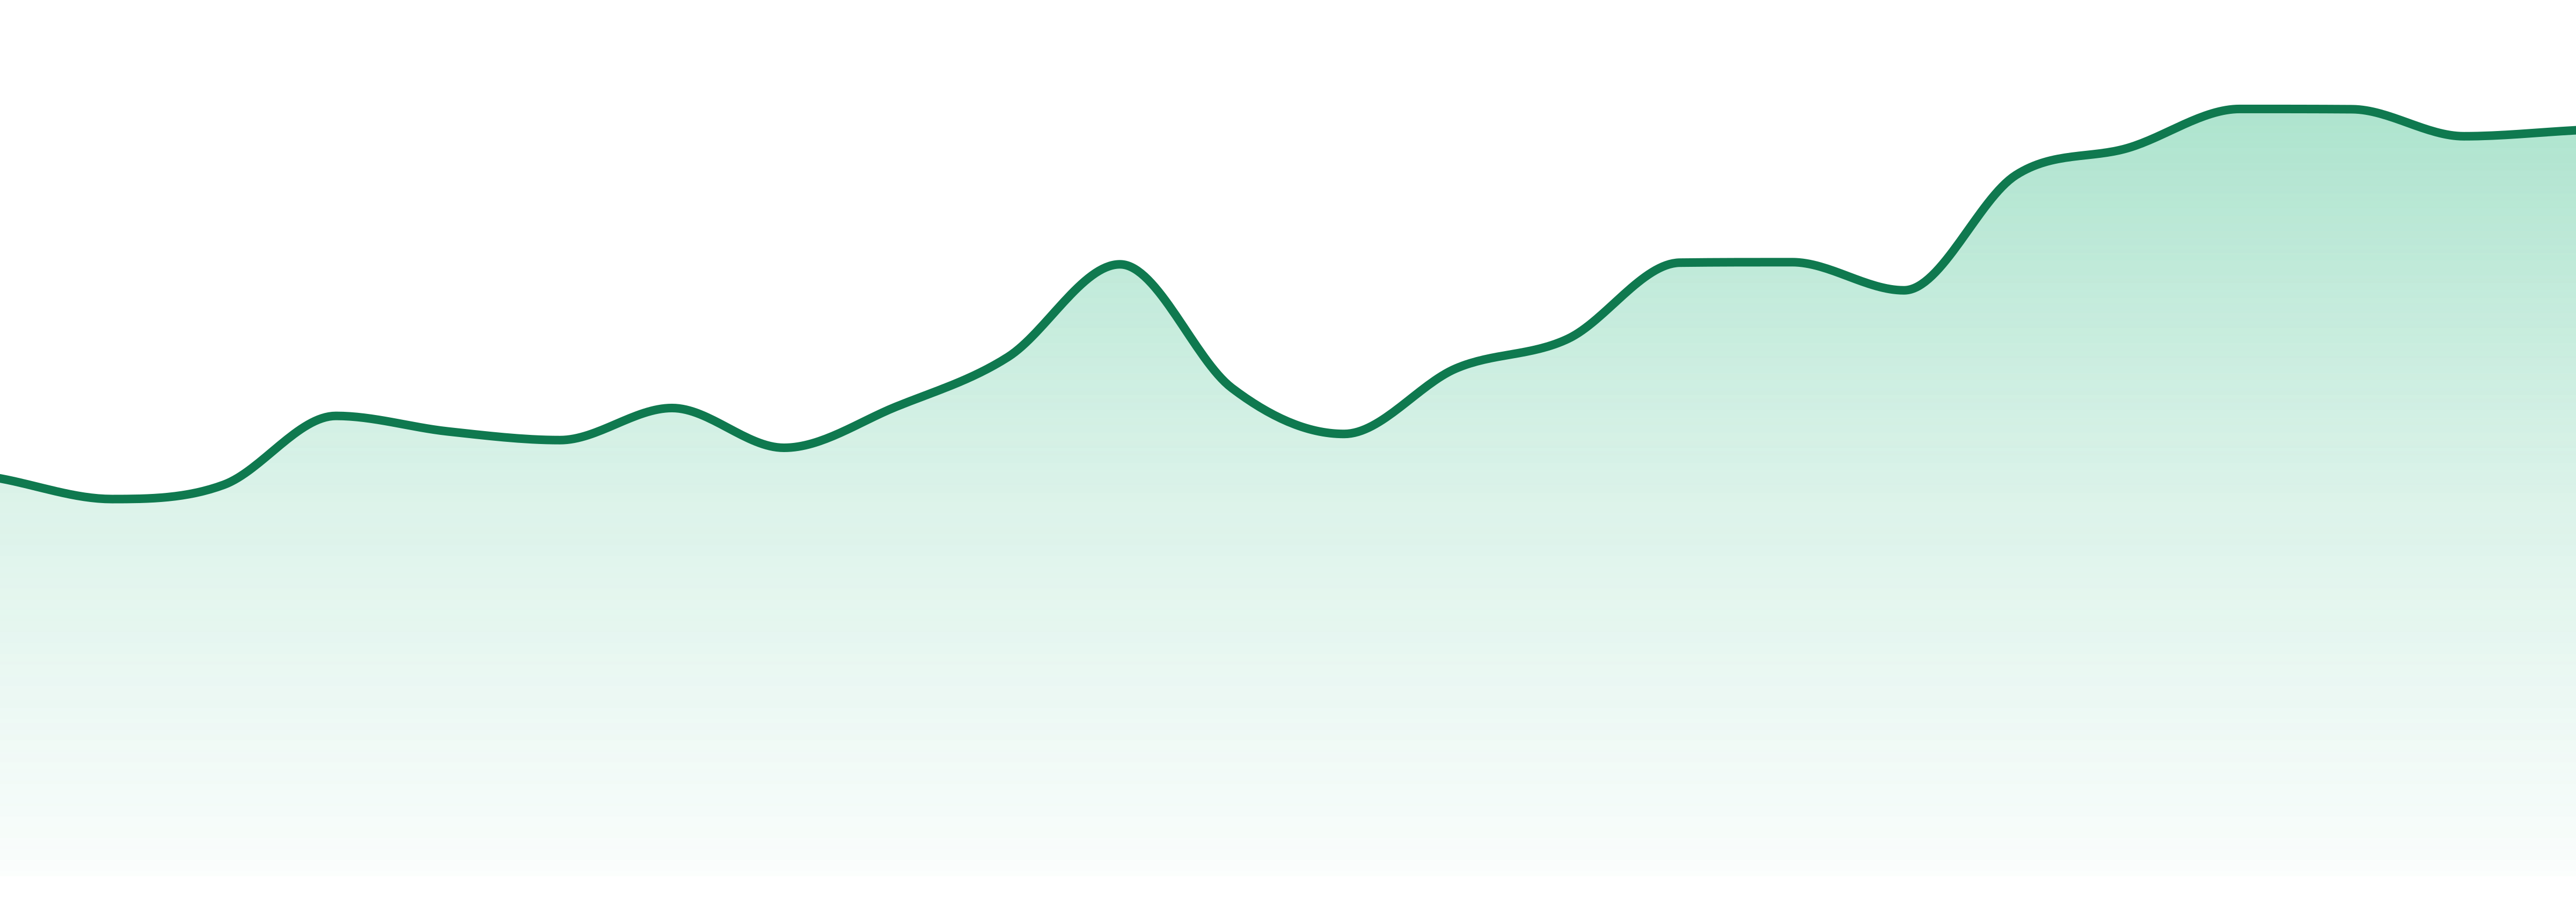
DIALED IN GUMMIES boasts an impressive YoY growth of +75.5%, firmly positioning itself in the mid-tier segment. With a 3-month sales trend of +19.6%, consumer demand continues to rise as the brand capitalizes on evolving buying patterns.
Categories
Top States
Dialed In Gummies Top StatesAug 2026Top states where Dialed In Gummies is active based on indexed sales coverage.
Trend View
Market Insights SnapshotAug 202624-Month Trend

Average Price
$19.81
YoY Sales Trend
52.8%
2Y Sales Trend
72.4%
Edibles dominate the market, accounting for 99.5% of total sales, with a staggering YoY growth of +75.2%. This category’s rapid expansion highlights its critical role in the cannabis landscape.
| Category | Sales Share | Avg Price | YoY |
|---|---|---|---|
Unlock The Full Table
Log in to unlock the full category breakout table and image export actions for this brand.
Trend View
Market Insights SnapshotAug 202624-Month Trend
Average Price
$19.81
YoY Sales Trend
52.8%
2Y Sales Trend
72.4%
Category Breakout
| Category | Sales Share | Avg Price | YoY |
|---|---|---|---|
| Edibles | 100.0% | $19.83 | 52.7% |
State Rank Table
| State | Edibles | Accessories | Concentrates | Oral | Vapor Pens |
|---|---|---|---|---|---|
| Colorado | 3 | ⊖ | ⊖ | 9 | ⊖ |
| Arizona | 8 | ⊖ | ⊖ | ⊖ | ⊖ |
| Missouri | 8 | ⊖ | ⊖ | ⊖ | ⊖ |
| Massachusetts | 17 | ⊖ | ⊖ | ⊖ | ⊖ |
| Ohio | 7 | ⊖ | 42 | ⊖ | ⊖ |
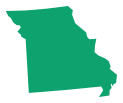
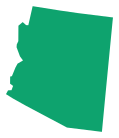
DIALED IN GUMMIES shines brightest in Colorado (55.2%), followed by Ohio (16.5%) and Missouri (13.7%). The brand is actively engaging consumers across five states, showcasing its geographic reach.
| State | Edibles | Accessories | Concentrates | Oral | Vapor Pens |
|---|---|---|---|---|---|
| 8 | ⊖ | ⊖ | ⊖ | ⊖ | |
| 17 | ⊖ | ⊖ | ⊖ | ⊖ | |
Unlock The Full Table
Log in to unlock the full state rank table and compare every category row for this brand.
Market Position
Competitive LandscapeAug 2026#3 in Edibles, DIALED IN GUMMIES is two spots behind WYLD (#1) and one behind WANA (#2). The competition is fierce with GOOD TIDE, RIPT, and KEEF also in the mix, yet DIALED IN maintains its strong position.
SKU View
Top Selling ProductsAug 2026Top products for Aug 2026 with sales and momentum indicators.
| Product | Category | MoM |
|---|---|---|
#2  | Edibles | 6.9% |
#4  | Edibles | 3.4% |
#6  | Edibles | 13.8% |
#8  | Edibles | 19.9% |
#10  | Edibles | 588.9% |
Unlock The Full Table
Log in to unlock the full top selling products table and export the share image for this section.
Benchmarking
Peer brands benchmarked against Dialed In Gummies using competitive landscape rank coverage, proximity, and momentum.