Top States
 Inhouse Top StatesAug 2026
Top states where Inhouse is active based on indexed sales coverage.
Is this your Brand? Log in to Hoodie!
Aug 2026
We’re InHouse – and we pride ourselves on offering a variety of high-quality cannabis products that are highly enjoyable for everyone. Whether you're a cannabis newcomer or a seasoned expert, we’ve got you covered with hand-grown flower, tasty vapes in flavors and strains, and al...
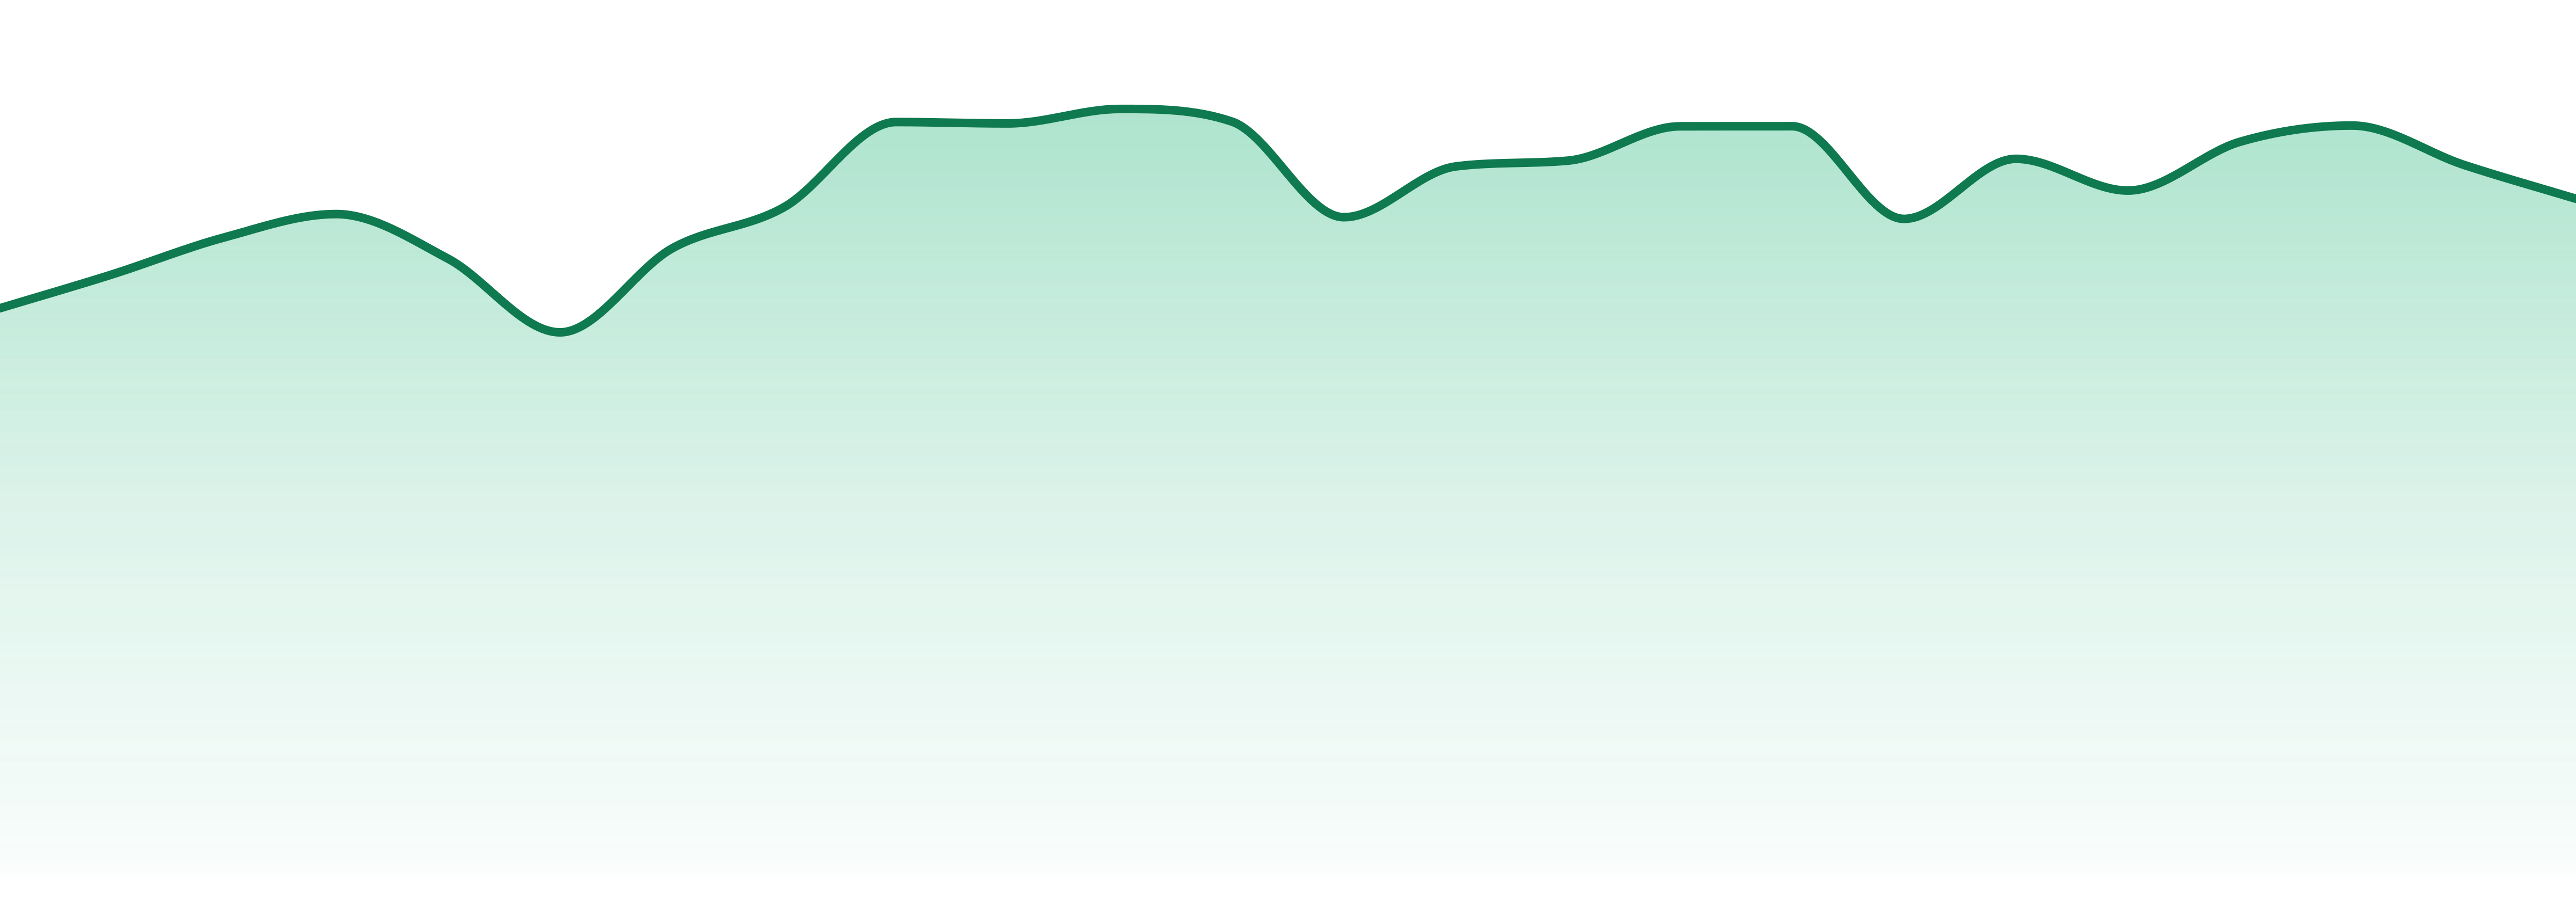
INHOUSE dropped from #8 to #13 in Massachusetts over 12 months, with a 9.0% quarterly sales decline erasing prior momentum. YoY growth sits at just +0.8%, and the mid-tier brand's recent 3.8% monthly uptick may not reverse the broader slide.
Categories
Top States
Inhouse Top StatesAug 2026Top states where Inhouse is active based on indexed sales coverage.
Trend View
Market Insights SnapshotAug 202624-Month Trend

Average Price
$23
YoY Sales Trend
10.2%
2Y Sales Trend
9.4%
Concentrates exploded +586.6% YoY but remain just 1.1% of mix. Pre-Rolls surged +148.0% and Edibles grew +30.3%, now 28.9% of total. Legacy pillars Vapes and Flower shrank -17.3% and -4.7% YoY, signaling a portfolio pivot underway.
| Category | Sales Share | Avg Price | YoY |
|---|---|---|---|
| Flower | 32.2% | $33.75 | 23.1% |
| Pre-Rolls | 3.8% | $10.18 | 55.5% |
Unlock The Full Table
Log in to unlock the full category breakout table and image export actions for this brand.
Trend View
Market Insights SnapshotAug 202624-Month Trend
Average Price
$23
YoY Sales Trend
10.2%
2Y Sales Trend
9.4%
Category Breakout
| Category | Sales Share | Avg Price | YoY |
|---|---|---|---|
| Vapes | 32.6% | $35 | 19.0% |
| Flower | 32.2% | $33.75 | 23.1% |
| Edibles | 30.8% | $14.89 | 22.4% |
| Pre-Rolls | 3.8% | $10.18 | 55.5% |
State Rank Table
| State | Vapor Pens | Flower | Edibles | Pre-Roll | Concentrates |
|---|---|---|---|---|---|
| Delaware | 3 | ⊖ | 3 | ⊖ | ⊖ |
| Maryland | 15 | 27 | 4 | ⊖ | ⊖ |
| Massachusetts | 25 | 14 | 9 | 44 | ⊖ |
| Illinois | 23 | 35 | 30 | ⊖ | 33 |
INHOUSE concentrates nearly 78% of sales across two states: Massachusetts at 40.8% and Maryland at 37.1%. Illinois adds 18.6%. Among top cannabis brands in Massachusetts, the five-state footprint remains narrowly anchored to the East Coast.
Unlock The Full Table
Log in to unlock the full state rank table and compare every category row for this brand.
Market Position
Competitive LandscapeAug 2026INHOUSE fell from #8 to #13 in Flower over 12 months, losing ground to every major peer. SIMPLY HERB holds #1, with HIGH SUPPLY at #2 and PERPETUAL HARVEST at #3. INSA, FARMER'S CUT, and REALM CANNABIS each gained 2-3 spots against INHOUSE.
SKU View
Top Selling ProductsAug 2026Top products for Aug 2026 with sales and momentum indicators.
| Product | Category | MoM |
|---|---|---|
#2  | Edibles | 11.5% |
#4 | Edibles | 5.8% |
#6  | Vapes | 49.7% |
#8  | Flower | 332.4% |
#10  | Vapes | 493.6% |
Unlock The Full Table
Log in to unlock the full top selling products table and export the share image for this section.
Benchmarking
Peer brands benchmarked against Inhouse using competitive landscape rank coverage, proximity, and momentum.